Part of the Wyoming Graduation Rate series.
The Wyoming student groups that started furthest behind in 2010 are the ones that gained the most ground by 2025. Students learning English gained 16.9 percentage points. Native American students, despite wild volatility, gained 16.9 points. Students who are currently homeless gained 15.5 points. Hispanic students gained 12.0 points. Students receiving free/reduced-price lunch gained 9.2 points.
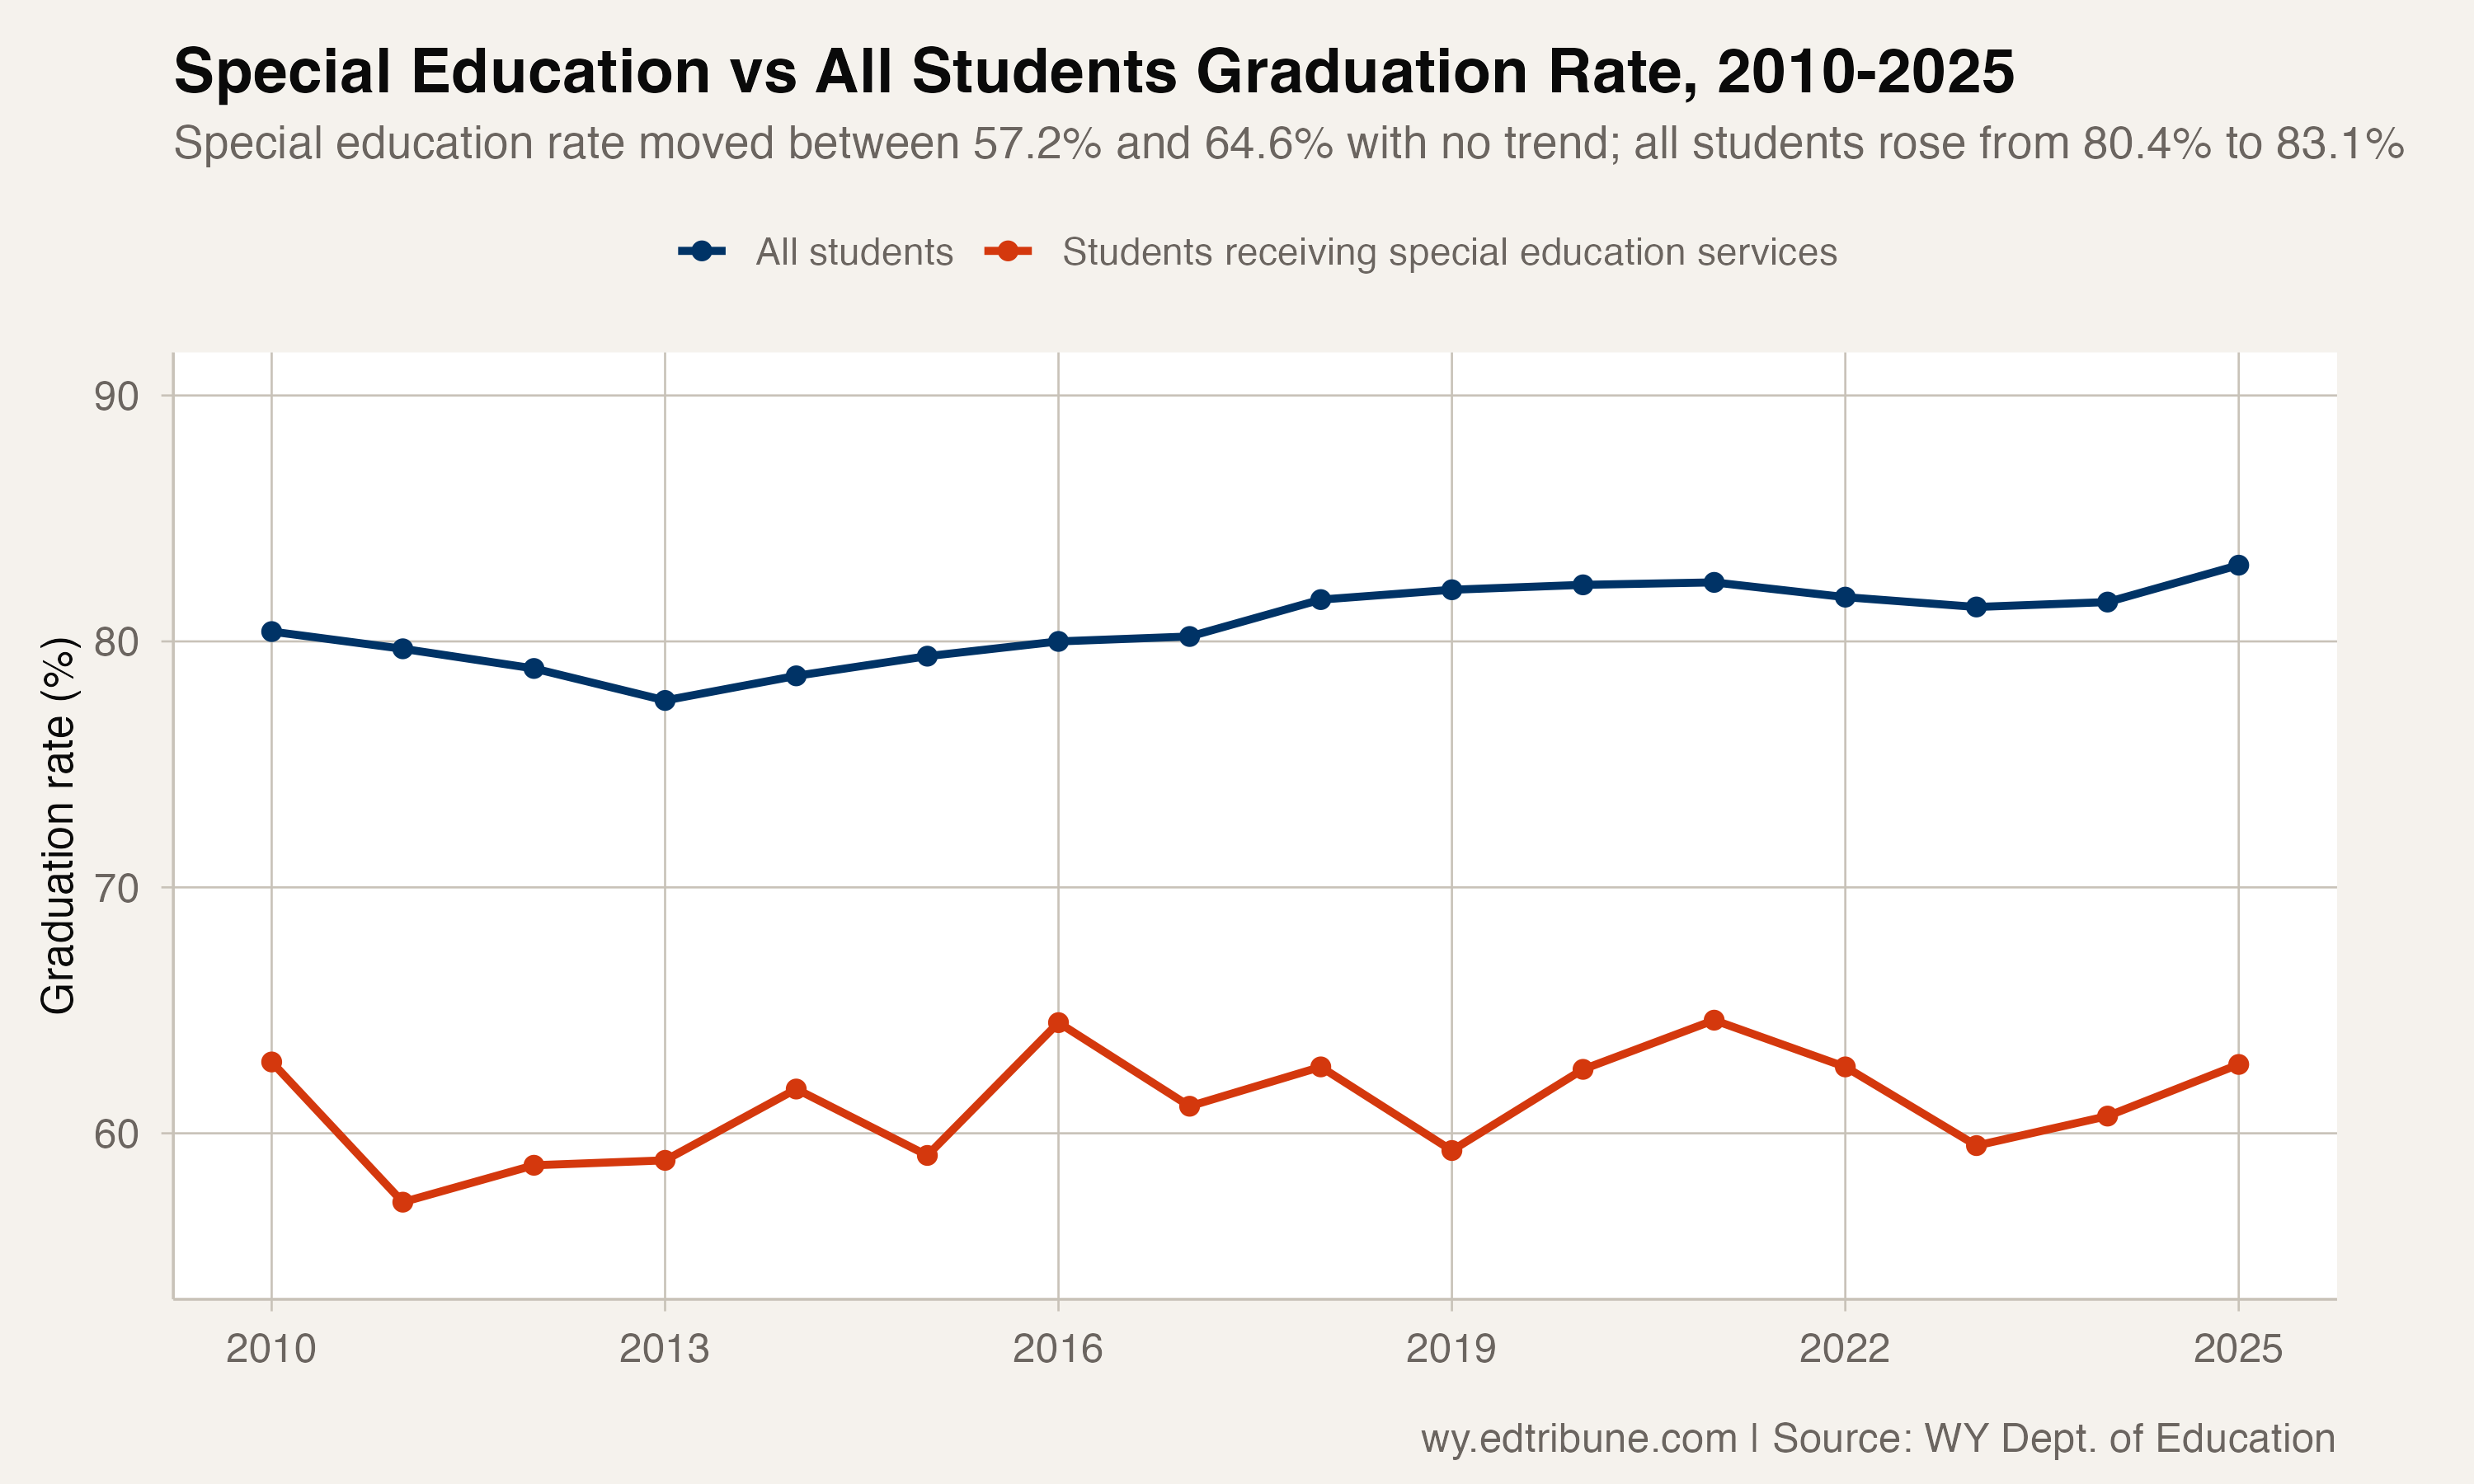
Students receiving special education services lost 0.1 points.
The rate was 62.9% in 2009-10. It was 62.8% in 2024-25. Over 16 years, through an eight-year statewide improvement streak, through COVID, through a record-setting rebound, the special education graduation rate did not move.
The gap that never closes
The distance between students receiving special education services and the state average has fluctuated between 15.5 and 22.8 percentage points over the full 16-year series, but the fluctuation has no direction. A straight line fitted through the 16 gap values rises by about a tenth of a point a year, which is well inside the year-to-year noise. The gap was 17.5 points in 2010 and 20.3 points in 2025 -- wider, not narrower.
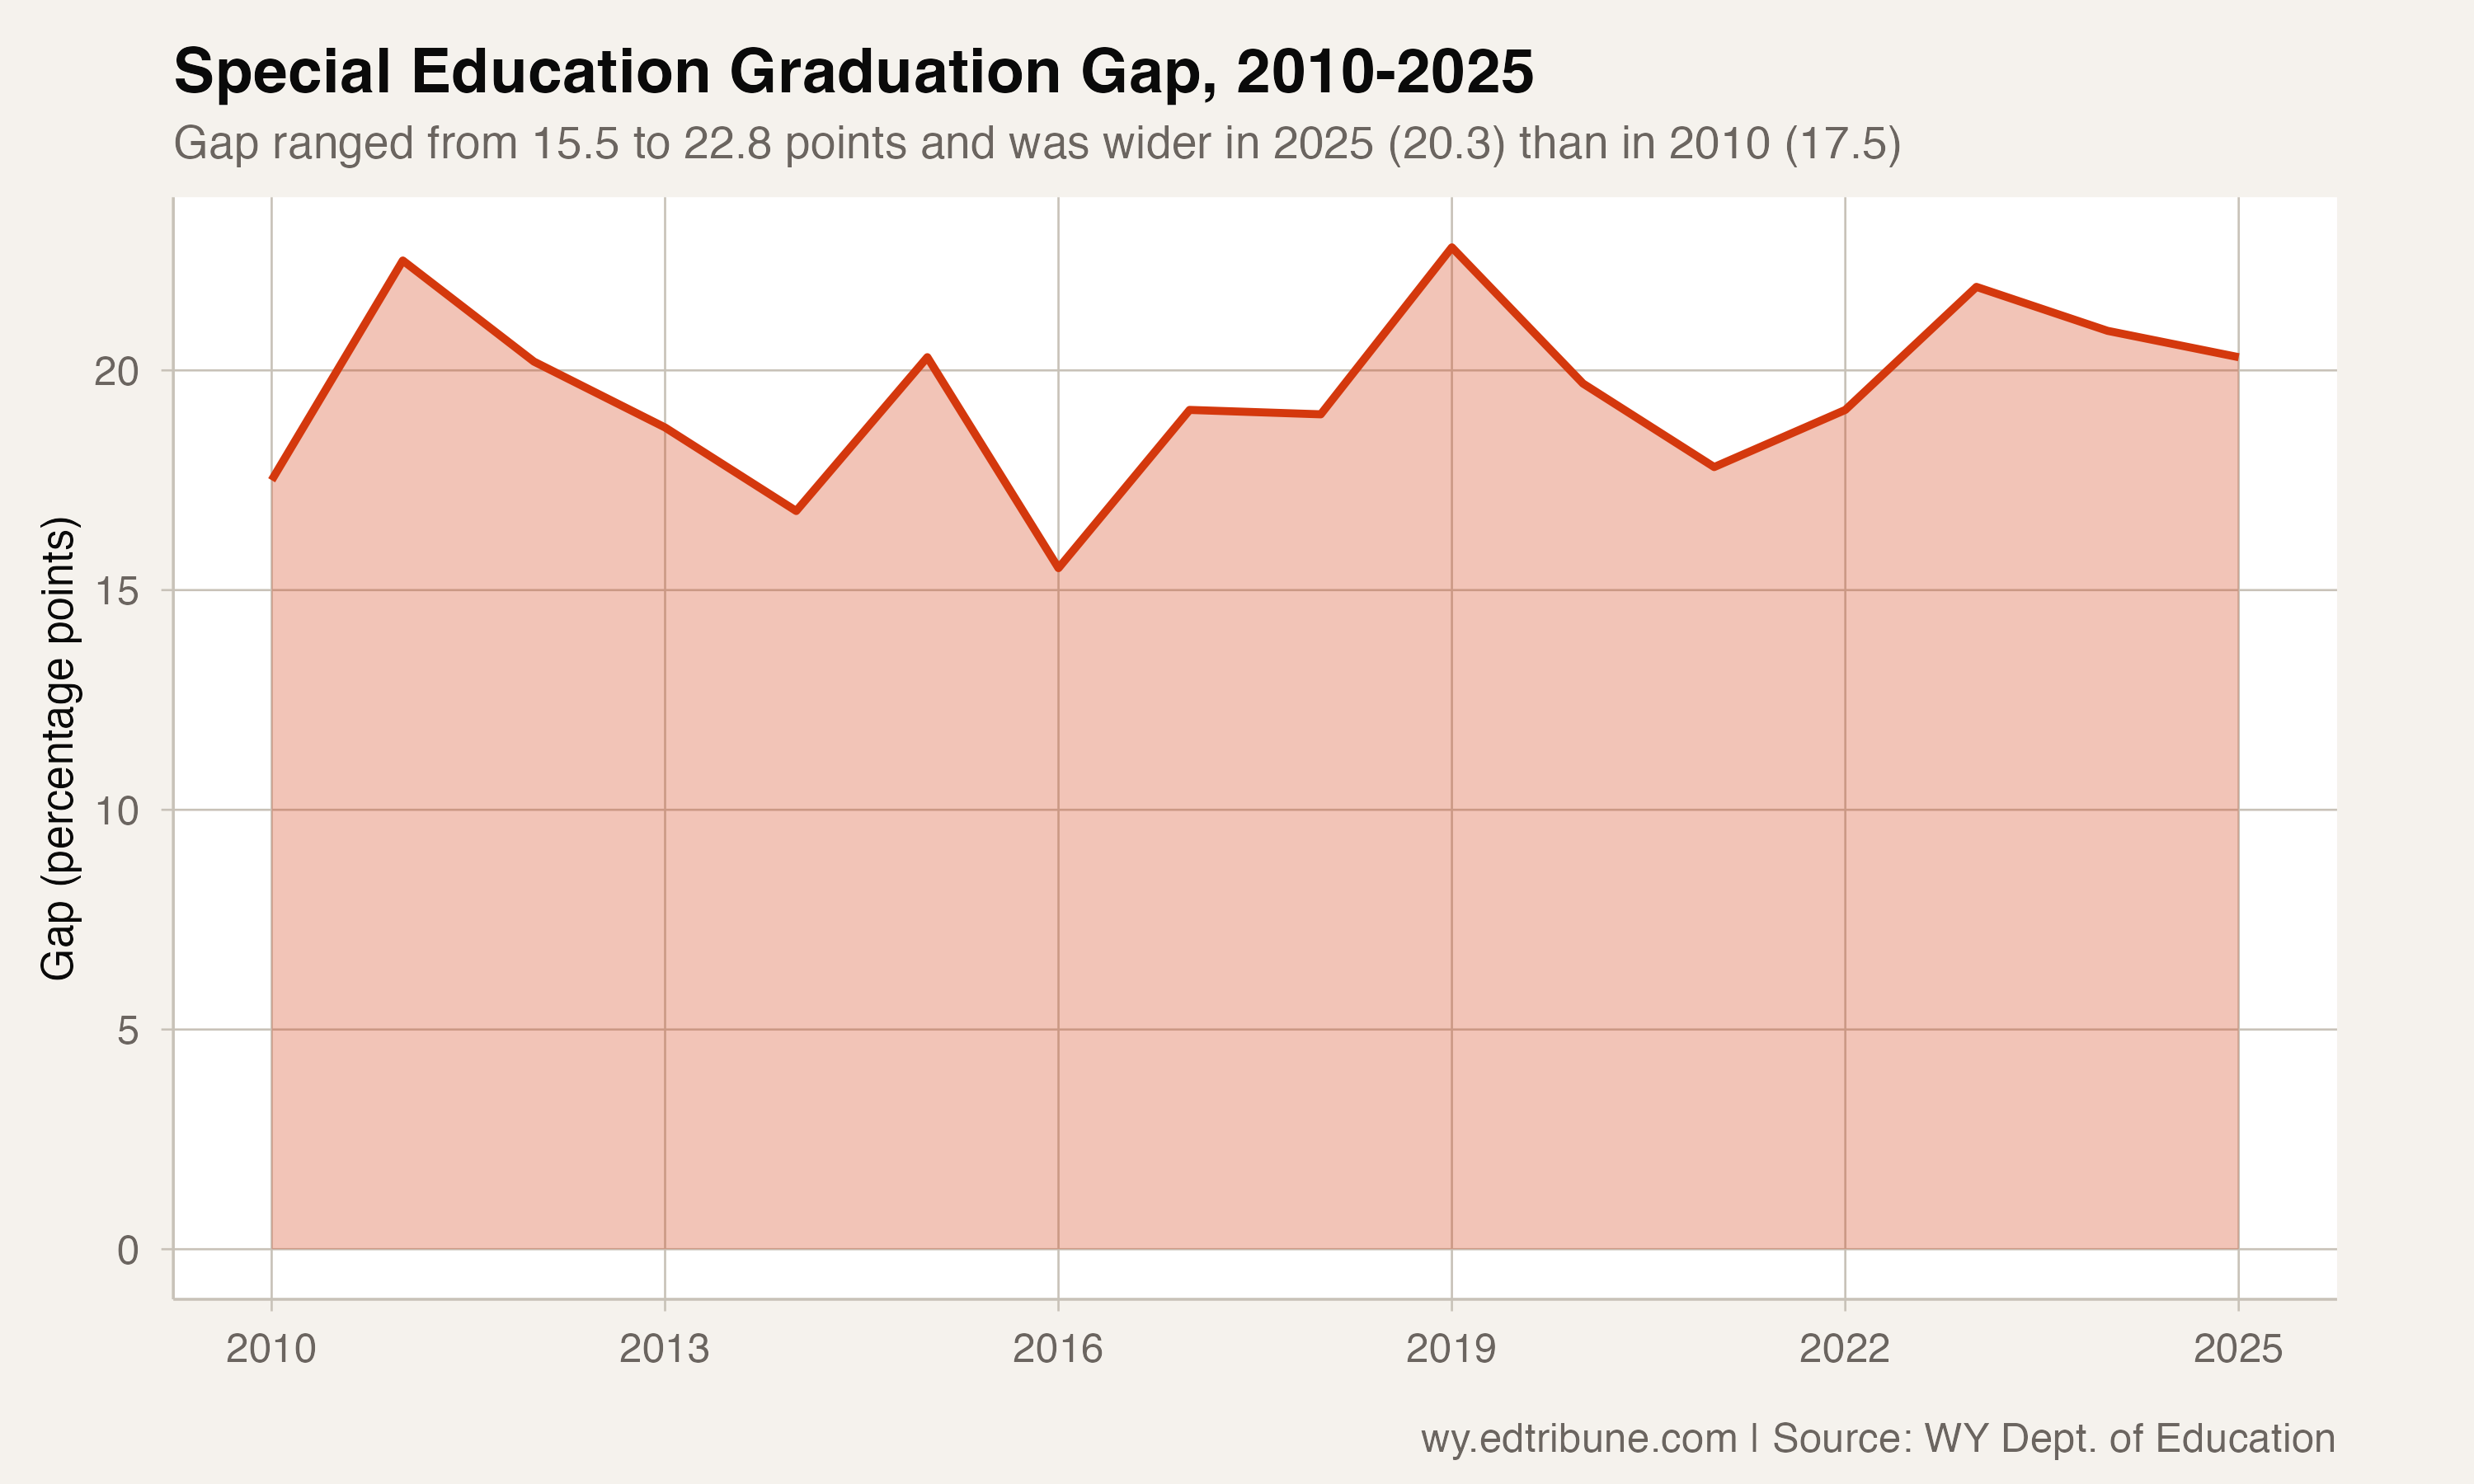
The narrowest gap (15.5 points, in 2015-16) came in one of the two strongest years the special education rate has posted, 64.5%. The widest gap (22.8 points, in 2018-19) came in a year the rate fell to 59.3%. Neither represented a trajectory -- the rate returned to its long-term average of roughly 61% after each excursion. Across the whole series the high is 64.6%, in 2020-21, and the low is 57.2%, in 2010-11.
What makes special education different
The contrast with other subgroups that started in a similar range is stark.
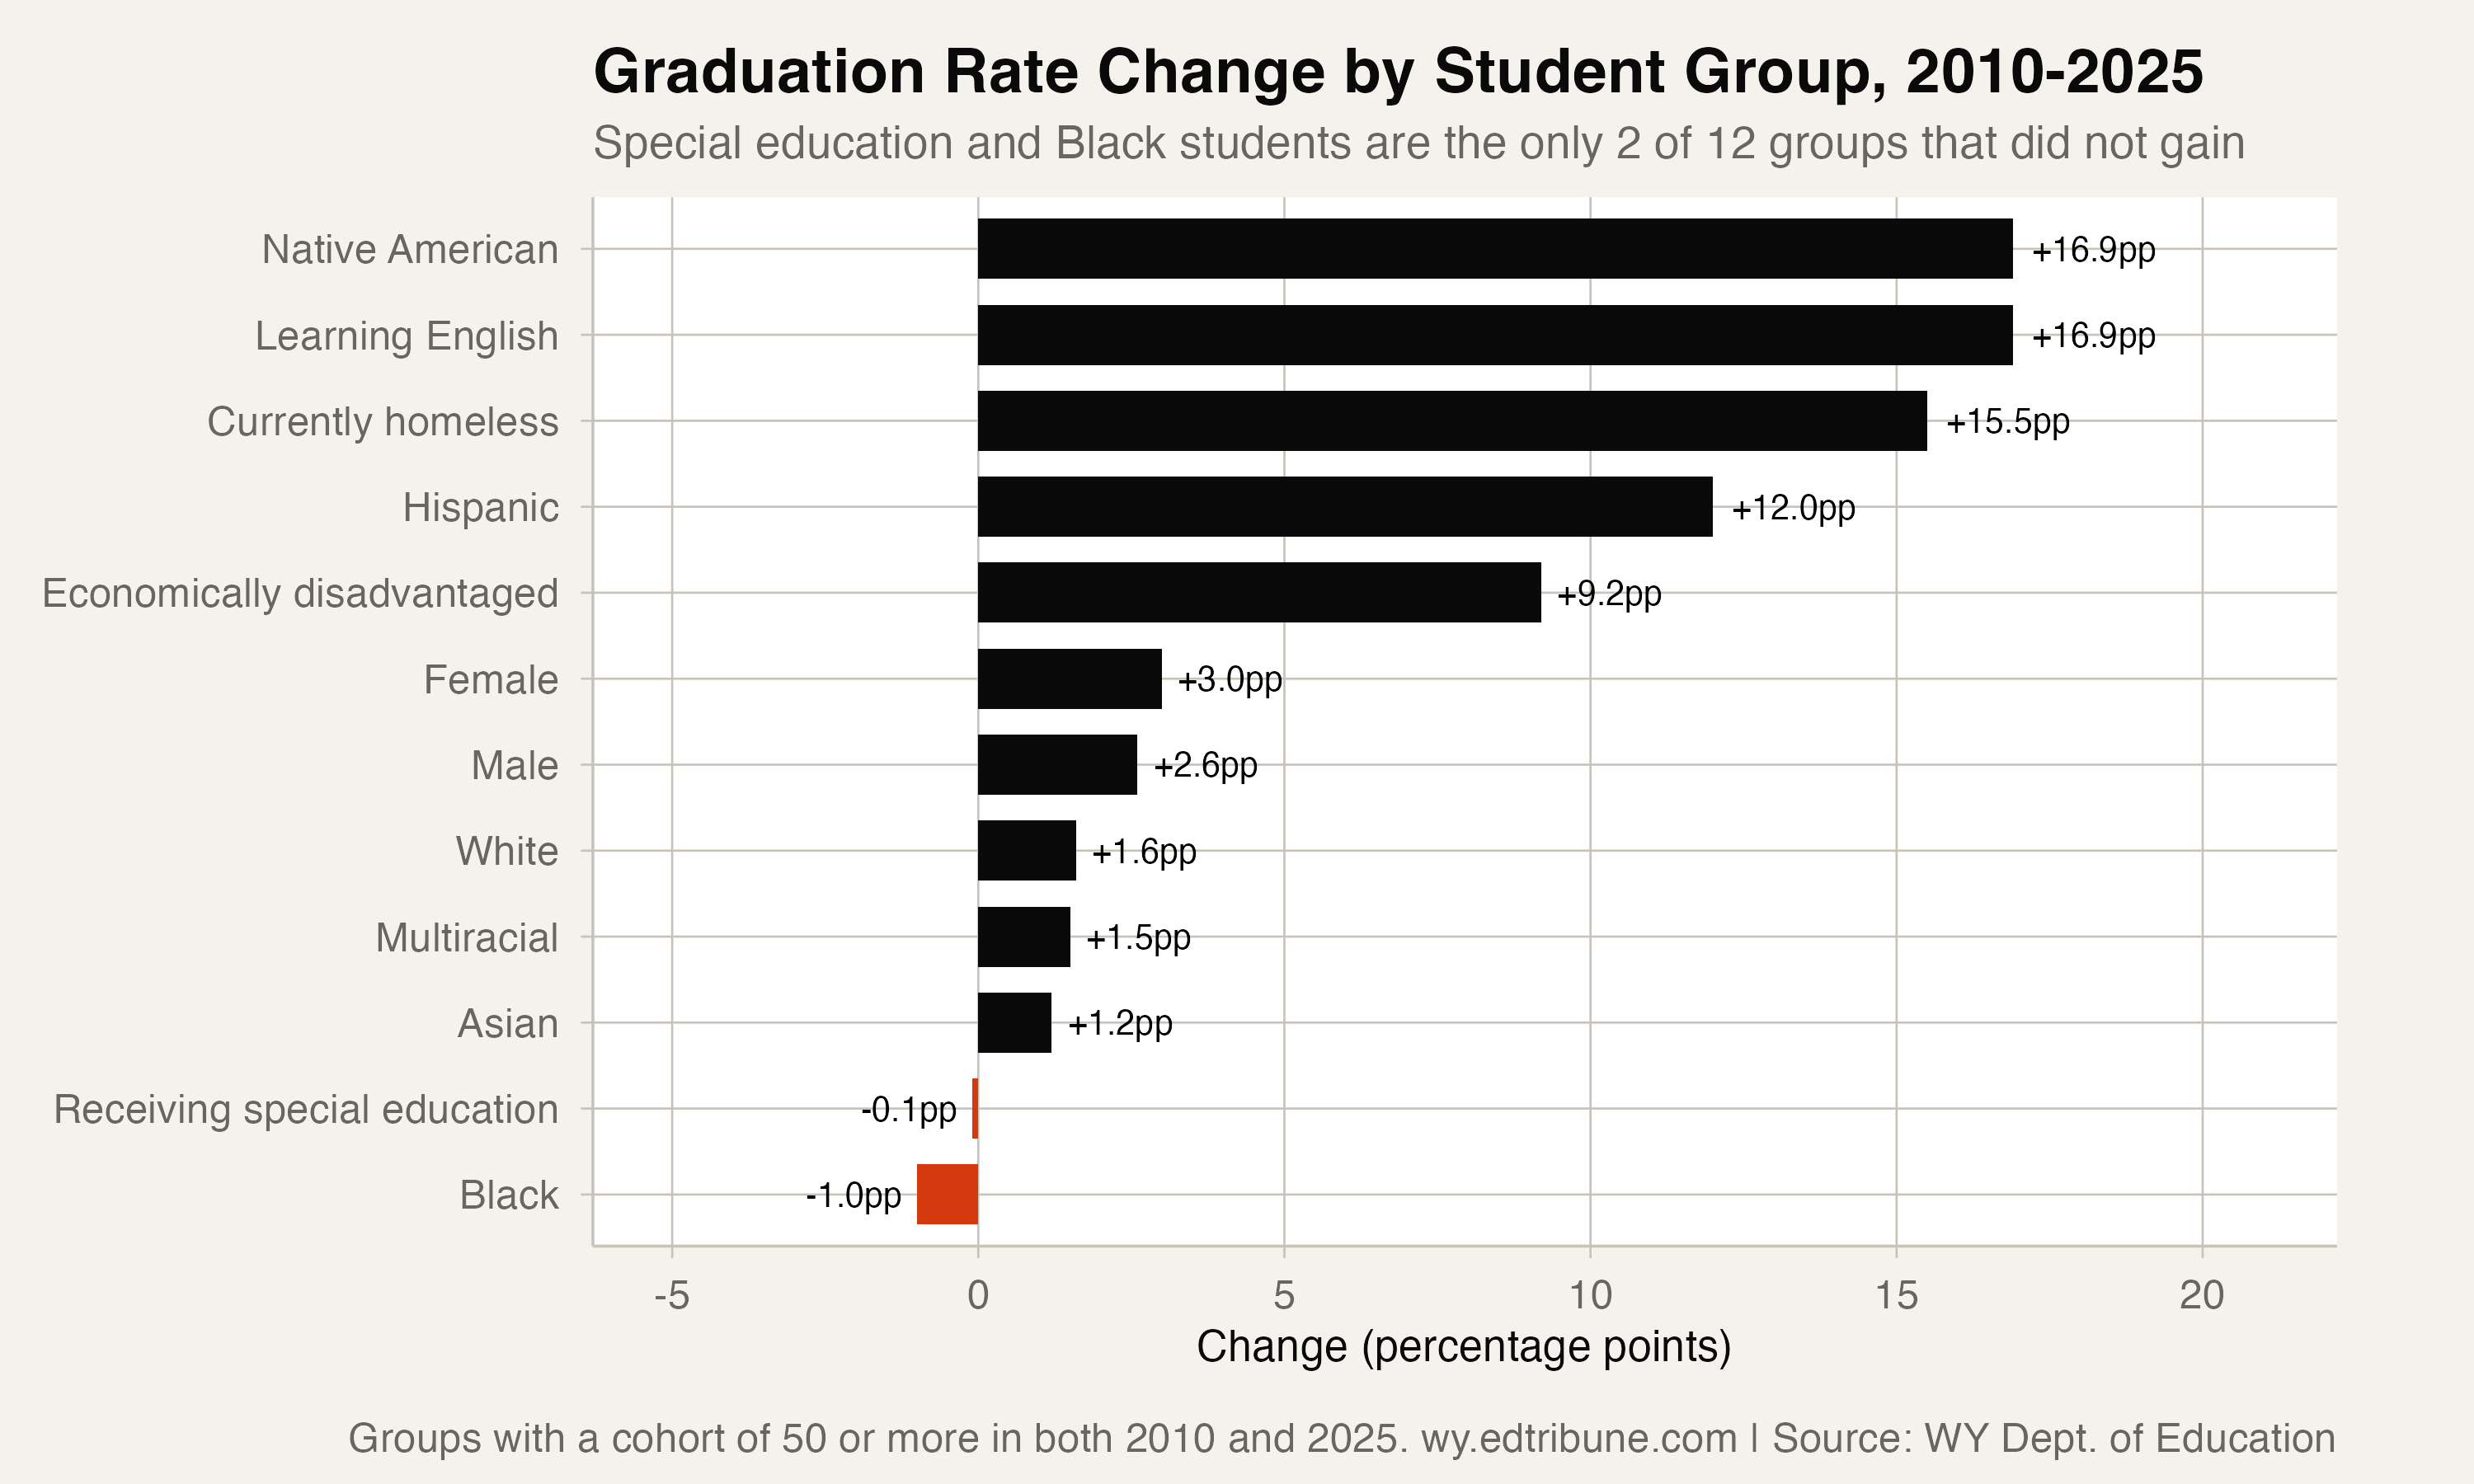
In 2010, students receiving free/reduced-price lunch graduated at 65.3% -- 2.4 points above the special education rate. By 2025, they had climbed to 74.5%, opening a lead of 11.7 points. Hispanic students started at 67.8% and now graduate at 79.8%. Students learning English began at 54.6% -- below special education -- and now surpass it at 71.5%.
Special education is not the only group that ended lower than it started. Wyoming publishes 2010 and 2025 rates for 15 student groups, and four of them declined: special education (-0.1 points), Black students (80.0% to 79.0%), students in migrant families (73.7% to 70.0%), and Pacific Islander students (100.0% to 60.0%). The last two are reported on cohorts of about 20 and 10 students, where one student moves the rate by several points. Narrow the field to the 12 groups with at least 50 students in the cohort in both years, and only two did not gain: special education and Black students, and Black students started 17 points above the special education rate and remain 16 points above it.
Whatever drove improvement for students receiving free/reduced-price lunch, Hispanic students, and students learning English -- targeted interventions, demographic shifts, policy changes, or some combination the data cannot separate -- did not show up in the special education rate.
The structural challenge
Students receiving special education services face graduation barriers that are categorically different from those faced by demographic subgroups. Disability-related accommodations, modified curricula, and individualized education programs (IEPs) are designed to support access to the general curriculum, but the pathway from IEP services to a standard diploma is not straightforward.
One thing did change over the 16 years: who the rate covers. The special education cohort grew from 838 students in 2010 to 1,084 in 2025, rising from 12.4% to 14.1% of Wyoming's graduating cohort. No single year moved that share by more than 1.4 points, so this is gradual growth in identification rather than a redefinition of the category. It does mean the flat rate is measured across a larger group of students in 2025 than in 2010, not a shrinking one.
Some students with significant cognitive disabilities are on alternative assessment tracks that do not lead to a standard 4-year diploma. Others need additional time, and the extended rates show it: for the 2022-23 cohort, the last one with a complete 6-year figure, the special education rate rises from 59.5% at four years to 62.5% at five and 63.1% at six. But the 4-year rate is the state's accountability metric, and at 62.8%, it has not responded to 16 years of statewide improvement.
The 2025 gap of 20.3 points means that for every five students with disabilities who enter ninth grade, roughly one fewer will graduate on time compared to the general population. That gap has been there every year the state has published a 4-year rate.
Detailed code that reproduces the analysis and figures in this article is available exclusively to EdTribune subscribers.
Discussion
Sign in to join the discussion.
Loading comments...