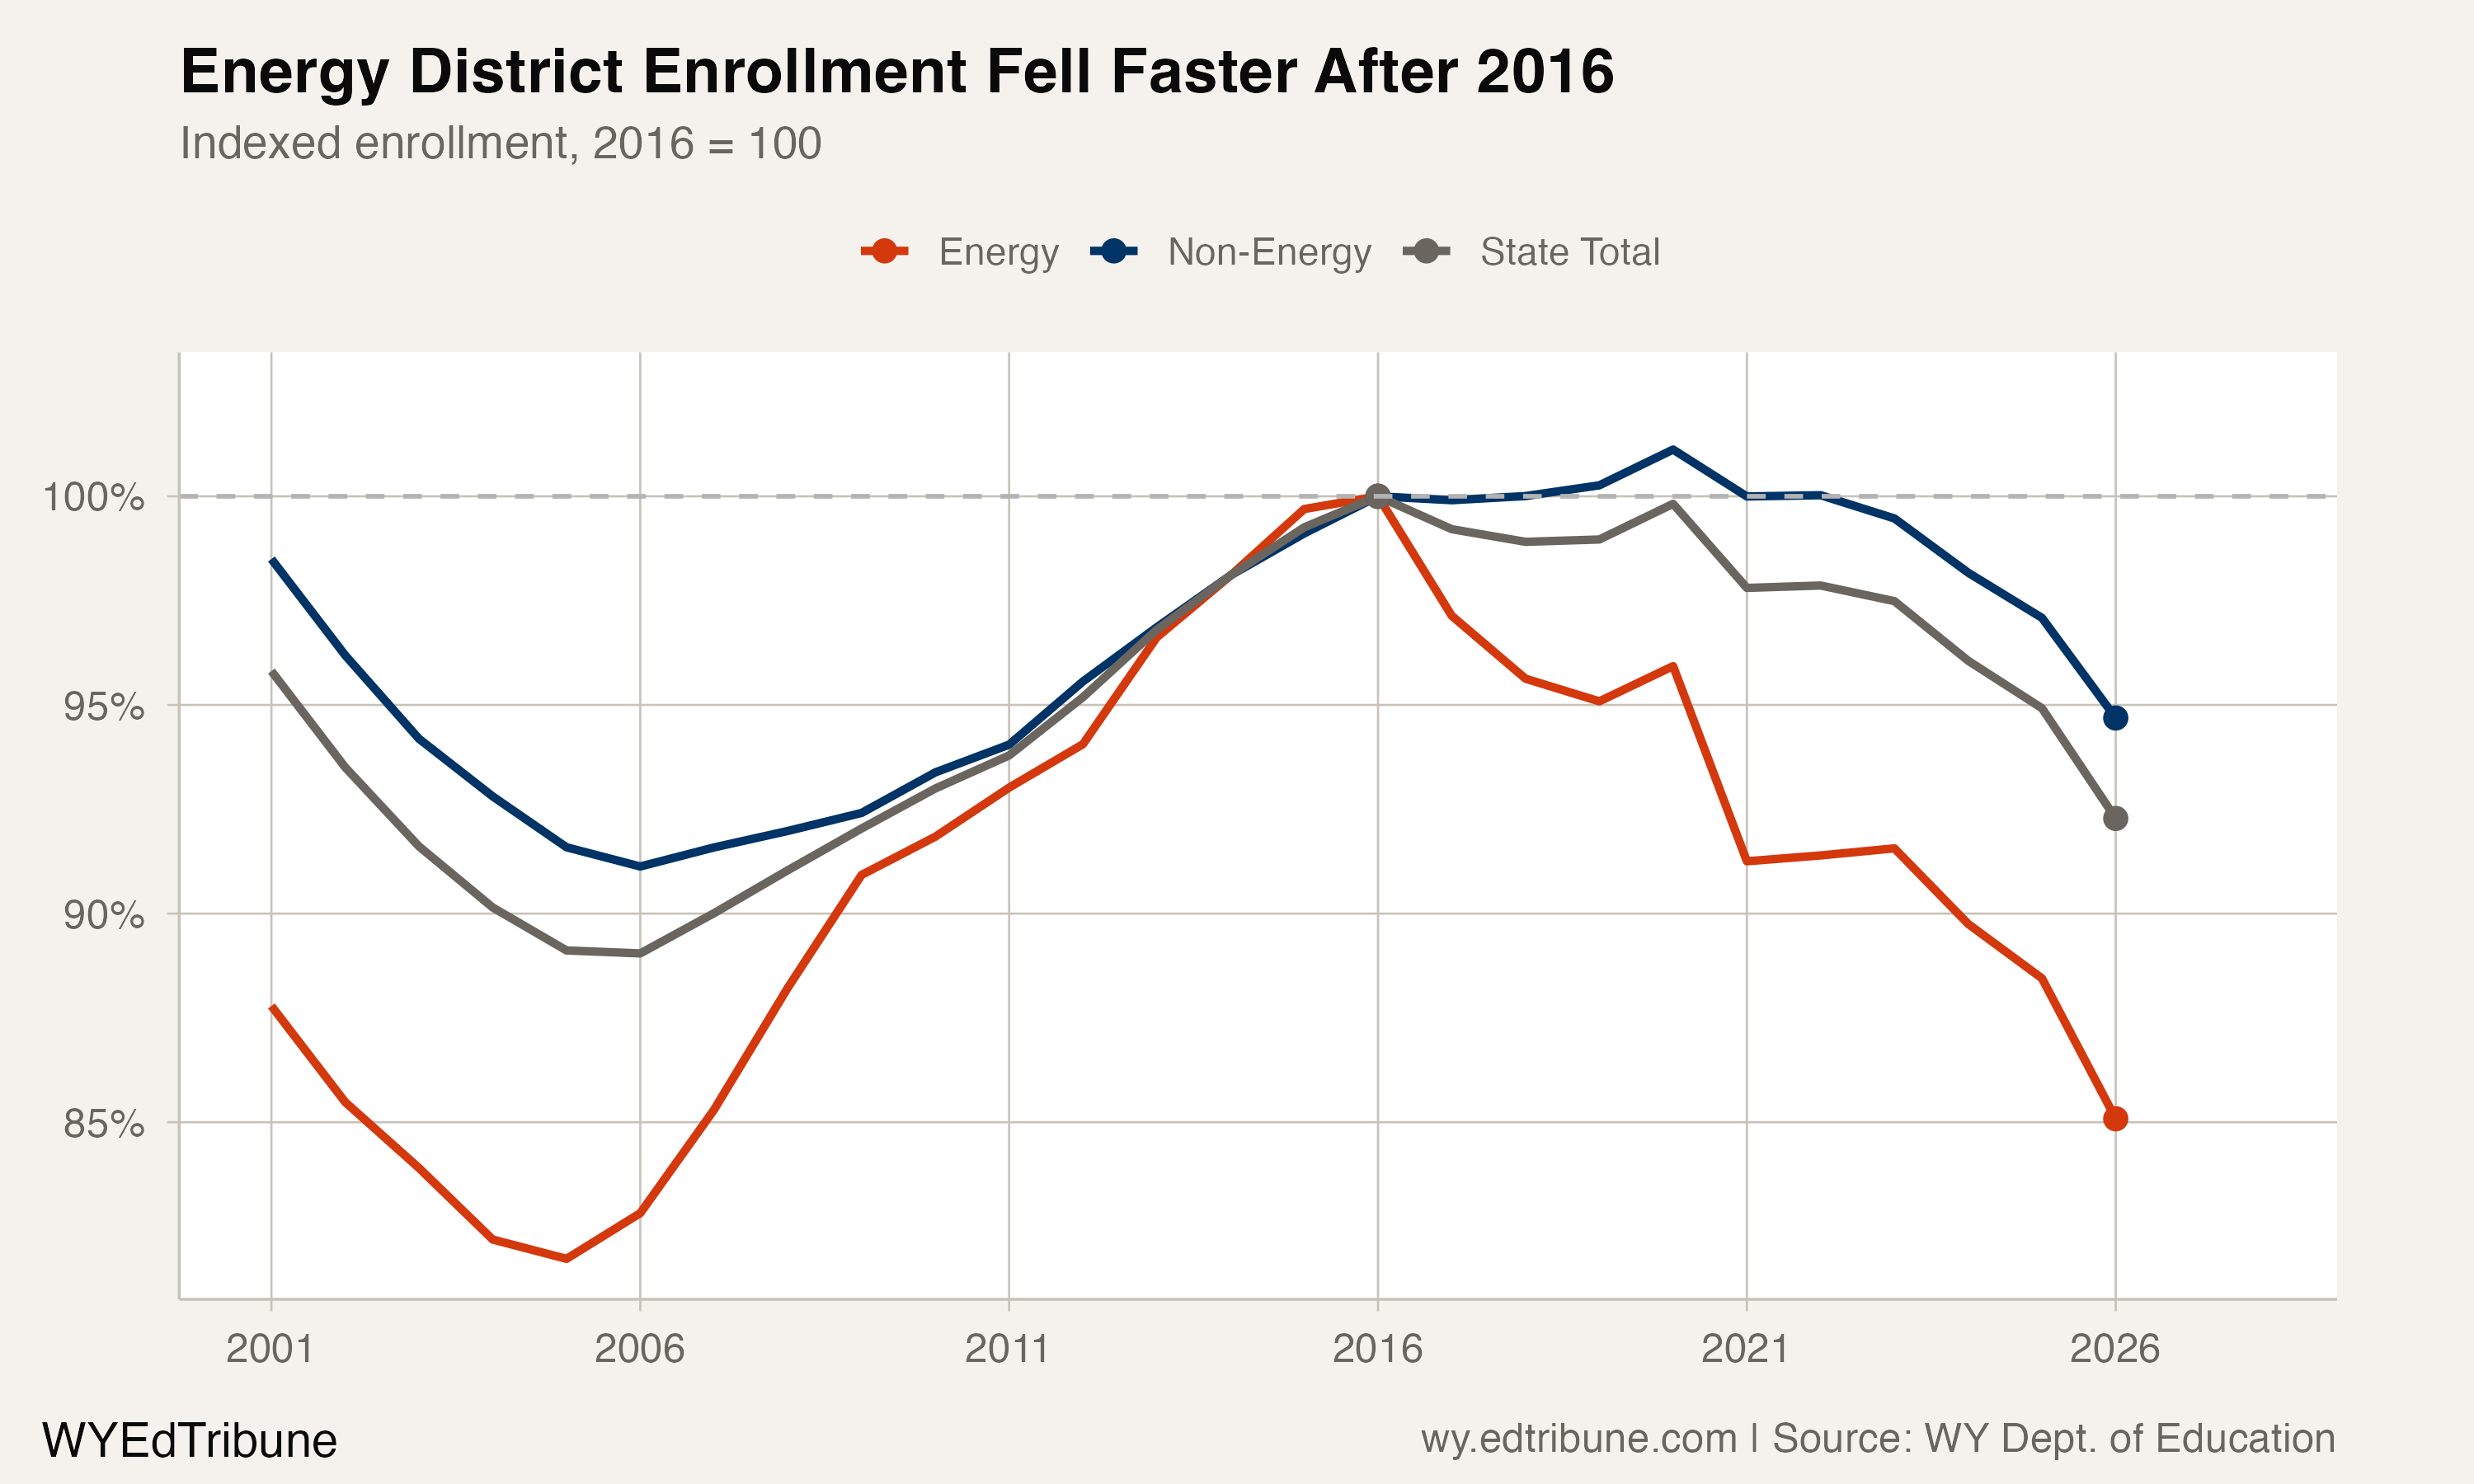
Wyoming's enrollment decline is not evenly distributed. The districts grouped here as energy-county districts are losing students at nearly three times the rate of the rest of the state.
Since the 2016 peak, the eight districts in energy-producing counties — Campbell #1↗ET, Sweetwater #1↗ET, Sweetwater #2↗ET, Carbon #1↗ET, Carbon #2, Converse #1↗ET, Sublette #1↗ET, and Sublette #9↗ET — have shed 14.9 percent of their combined enrollment. Non-energy districts have declined 5.3 percent.
The energy counties added nearly 40 percent of the statewide growth during the boom decade. Now they are contributing a disproportionate share of the collapse.
Rock Springs: the sharpest fall
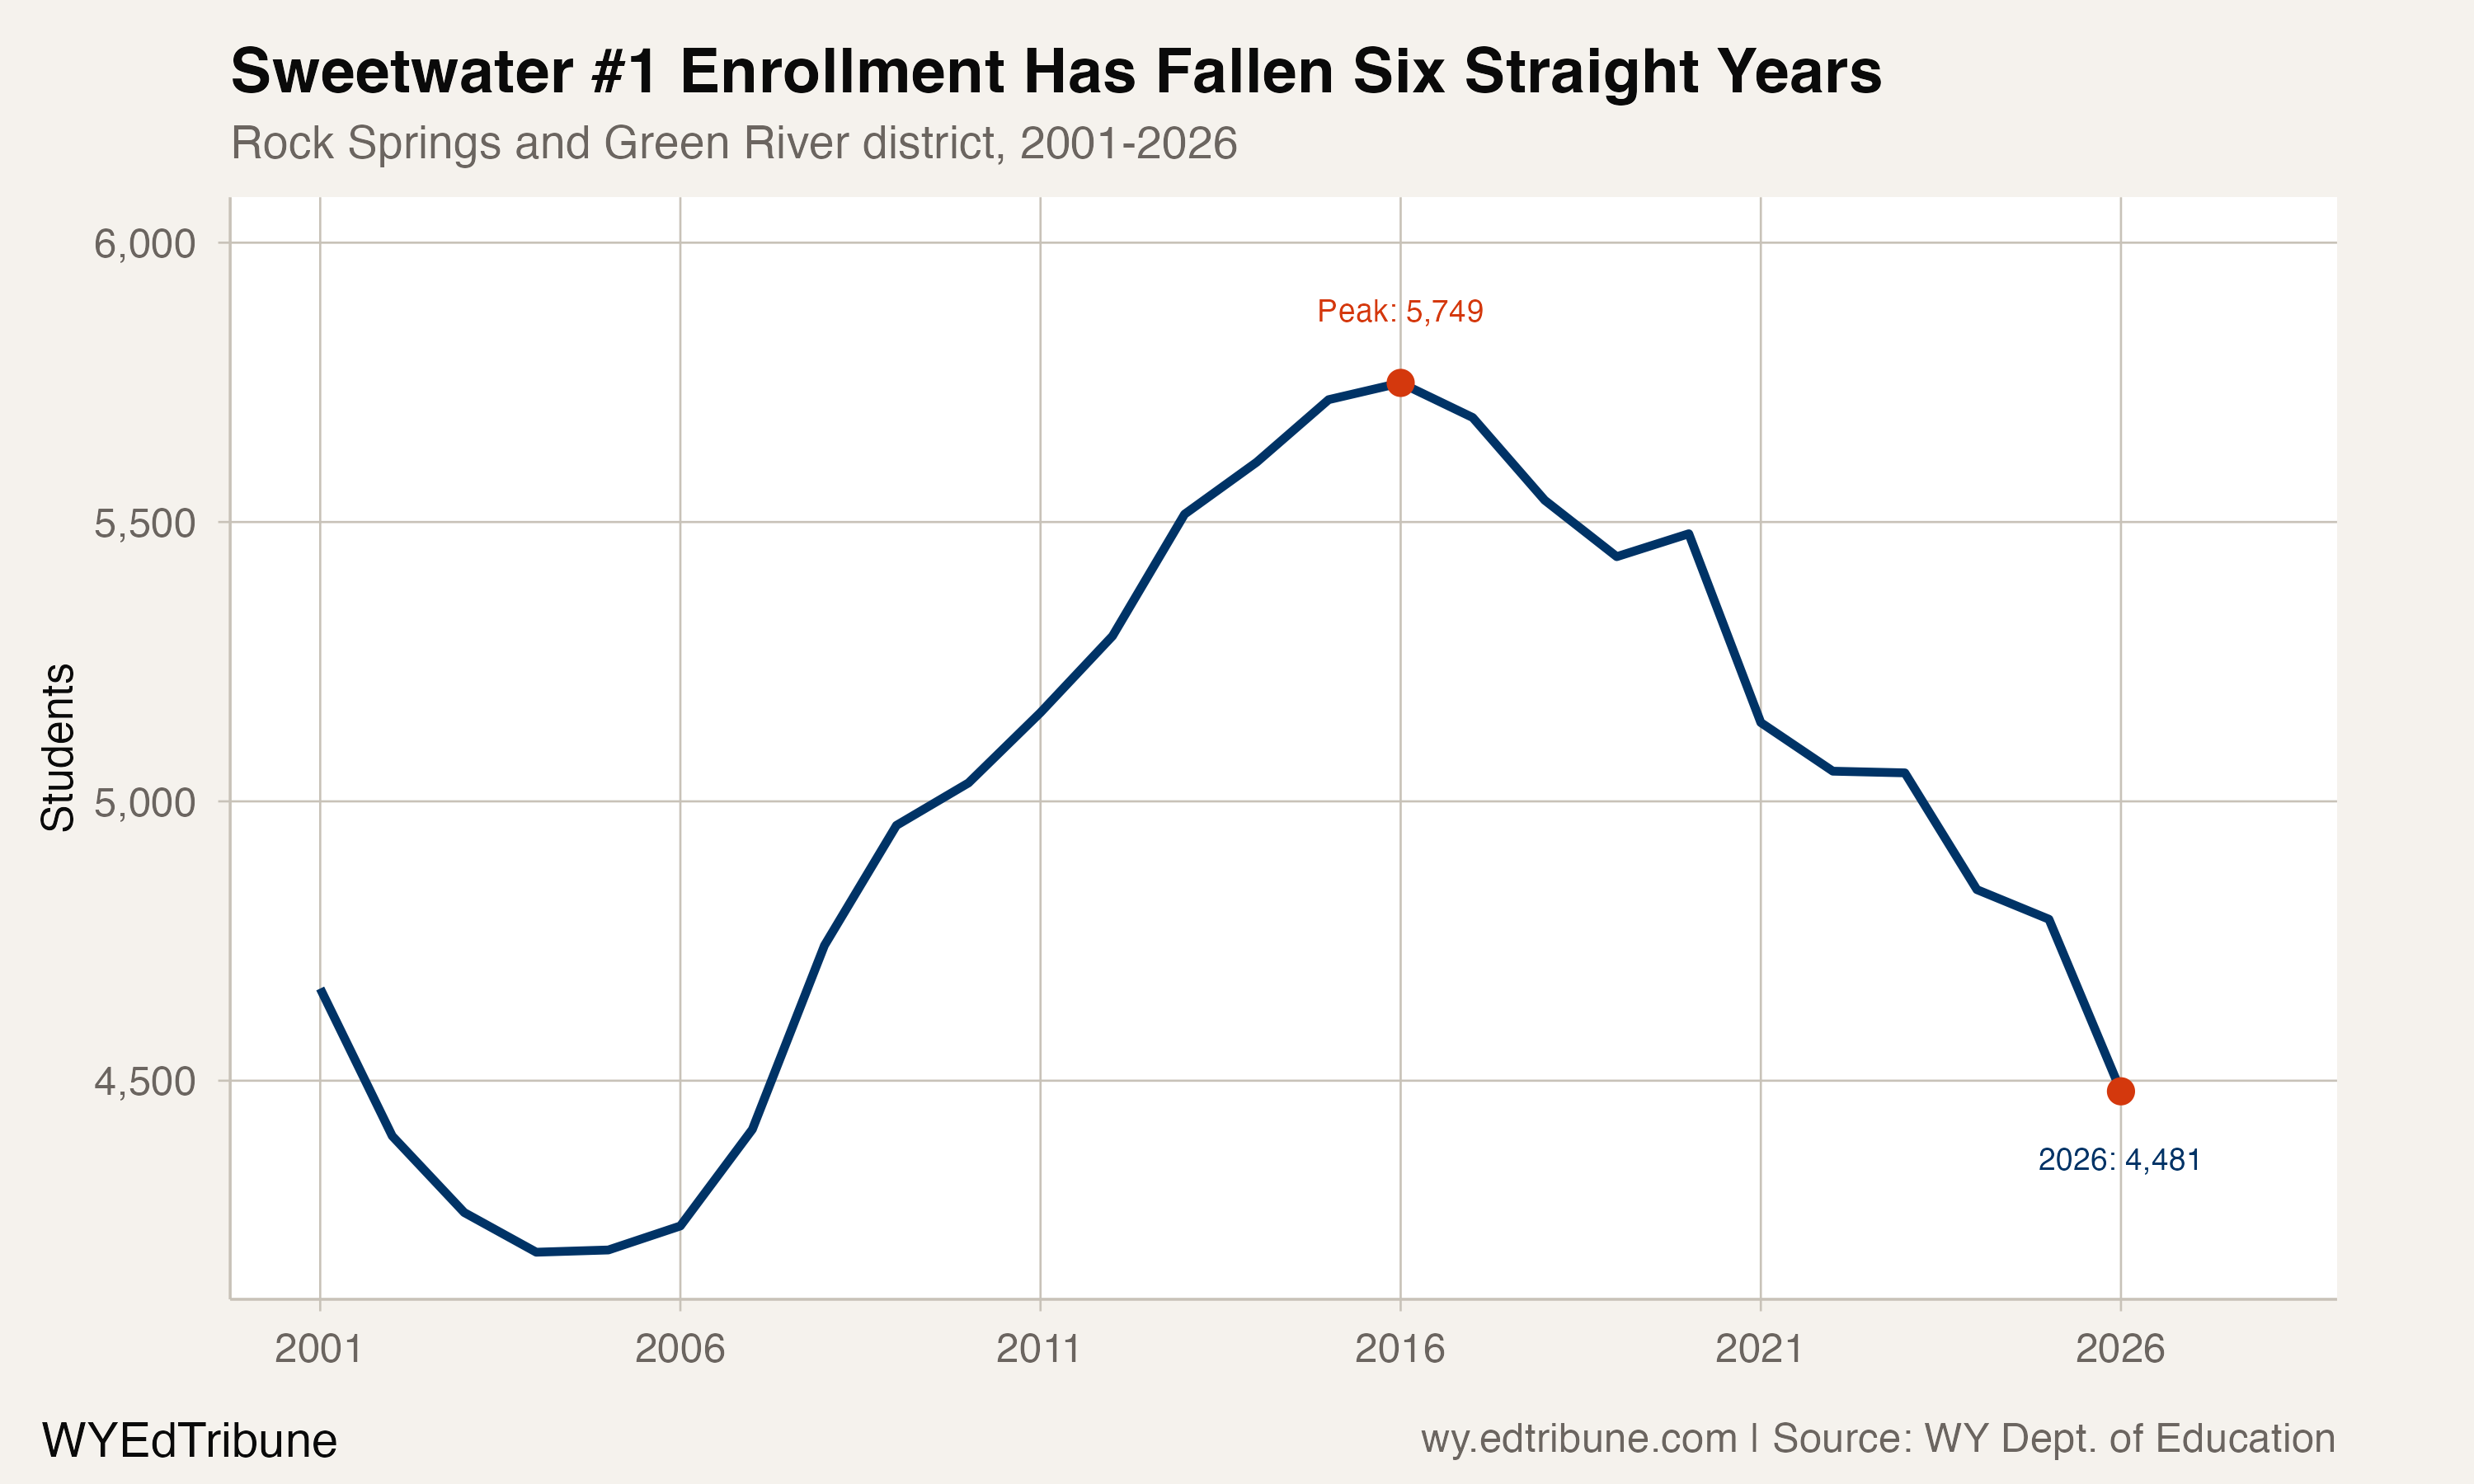
Sweetwater #1↗ET, covering Rock Springs and Green River, is the clearest case study. The district peaked at 5,749 students in 2016. Since then, it has fallen 22.1 percent to 4,481.
The decline has been relentless. Sweetwater #1 has lost students in six consecutive years: 338 in 2021, 87 in 2022, 3 in 2023, 209 in 2024, 53 in 2025, and 308 in 2026. The 2026 loss was the district's worst year since the initial COVID impact.
Every energy district is down
Not a single energy-producing district has more students in 2026 than it did at the 2016 peak. The losses range from 6 percent in Sublette #1 to 33 percent in Sublette #9↗ET.
Campbell #1↗ET (Gillette), the state's third-largest district, dropped from 9,177 to 8,198 — a 10.7 percent decline. Carbon #1↗ET (Rawlins) is down 15.7 percent. Sweetwater #2↗ET (Green River) is down 18.8 percent.
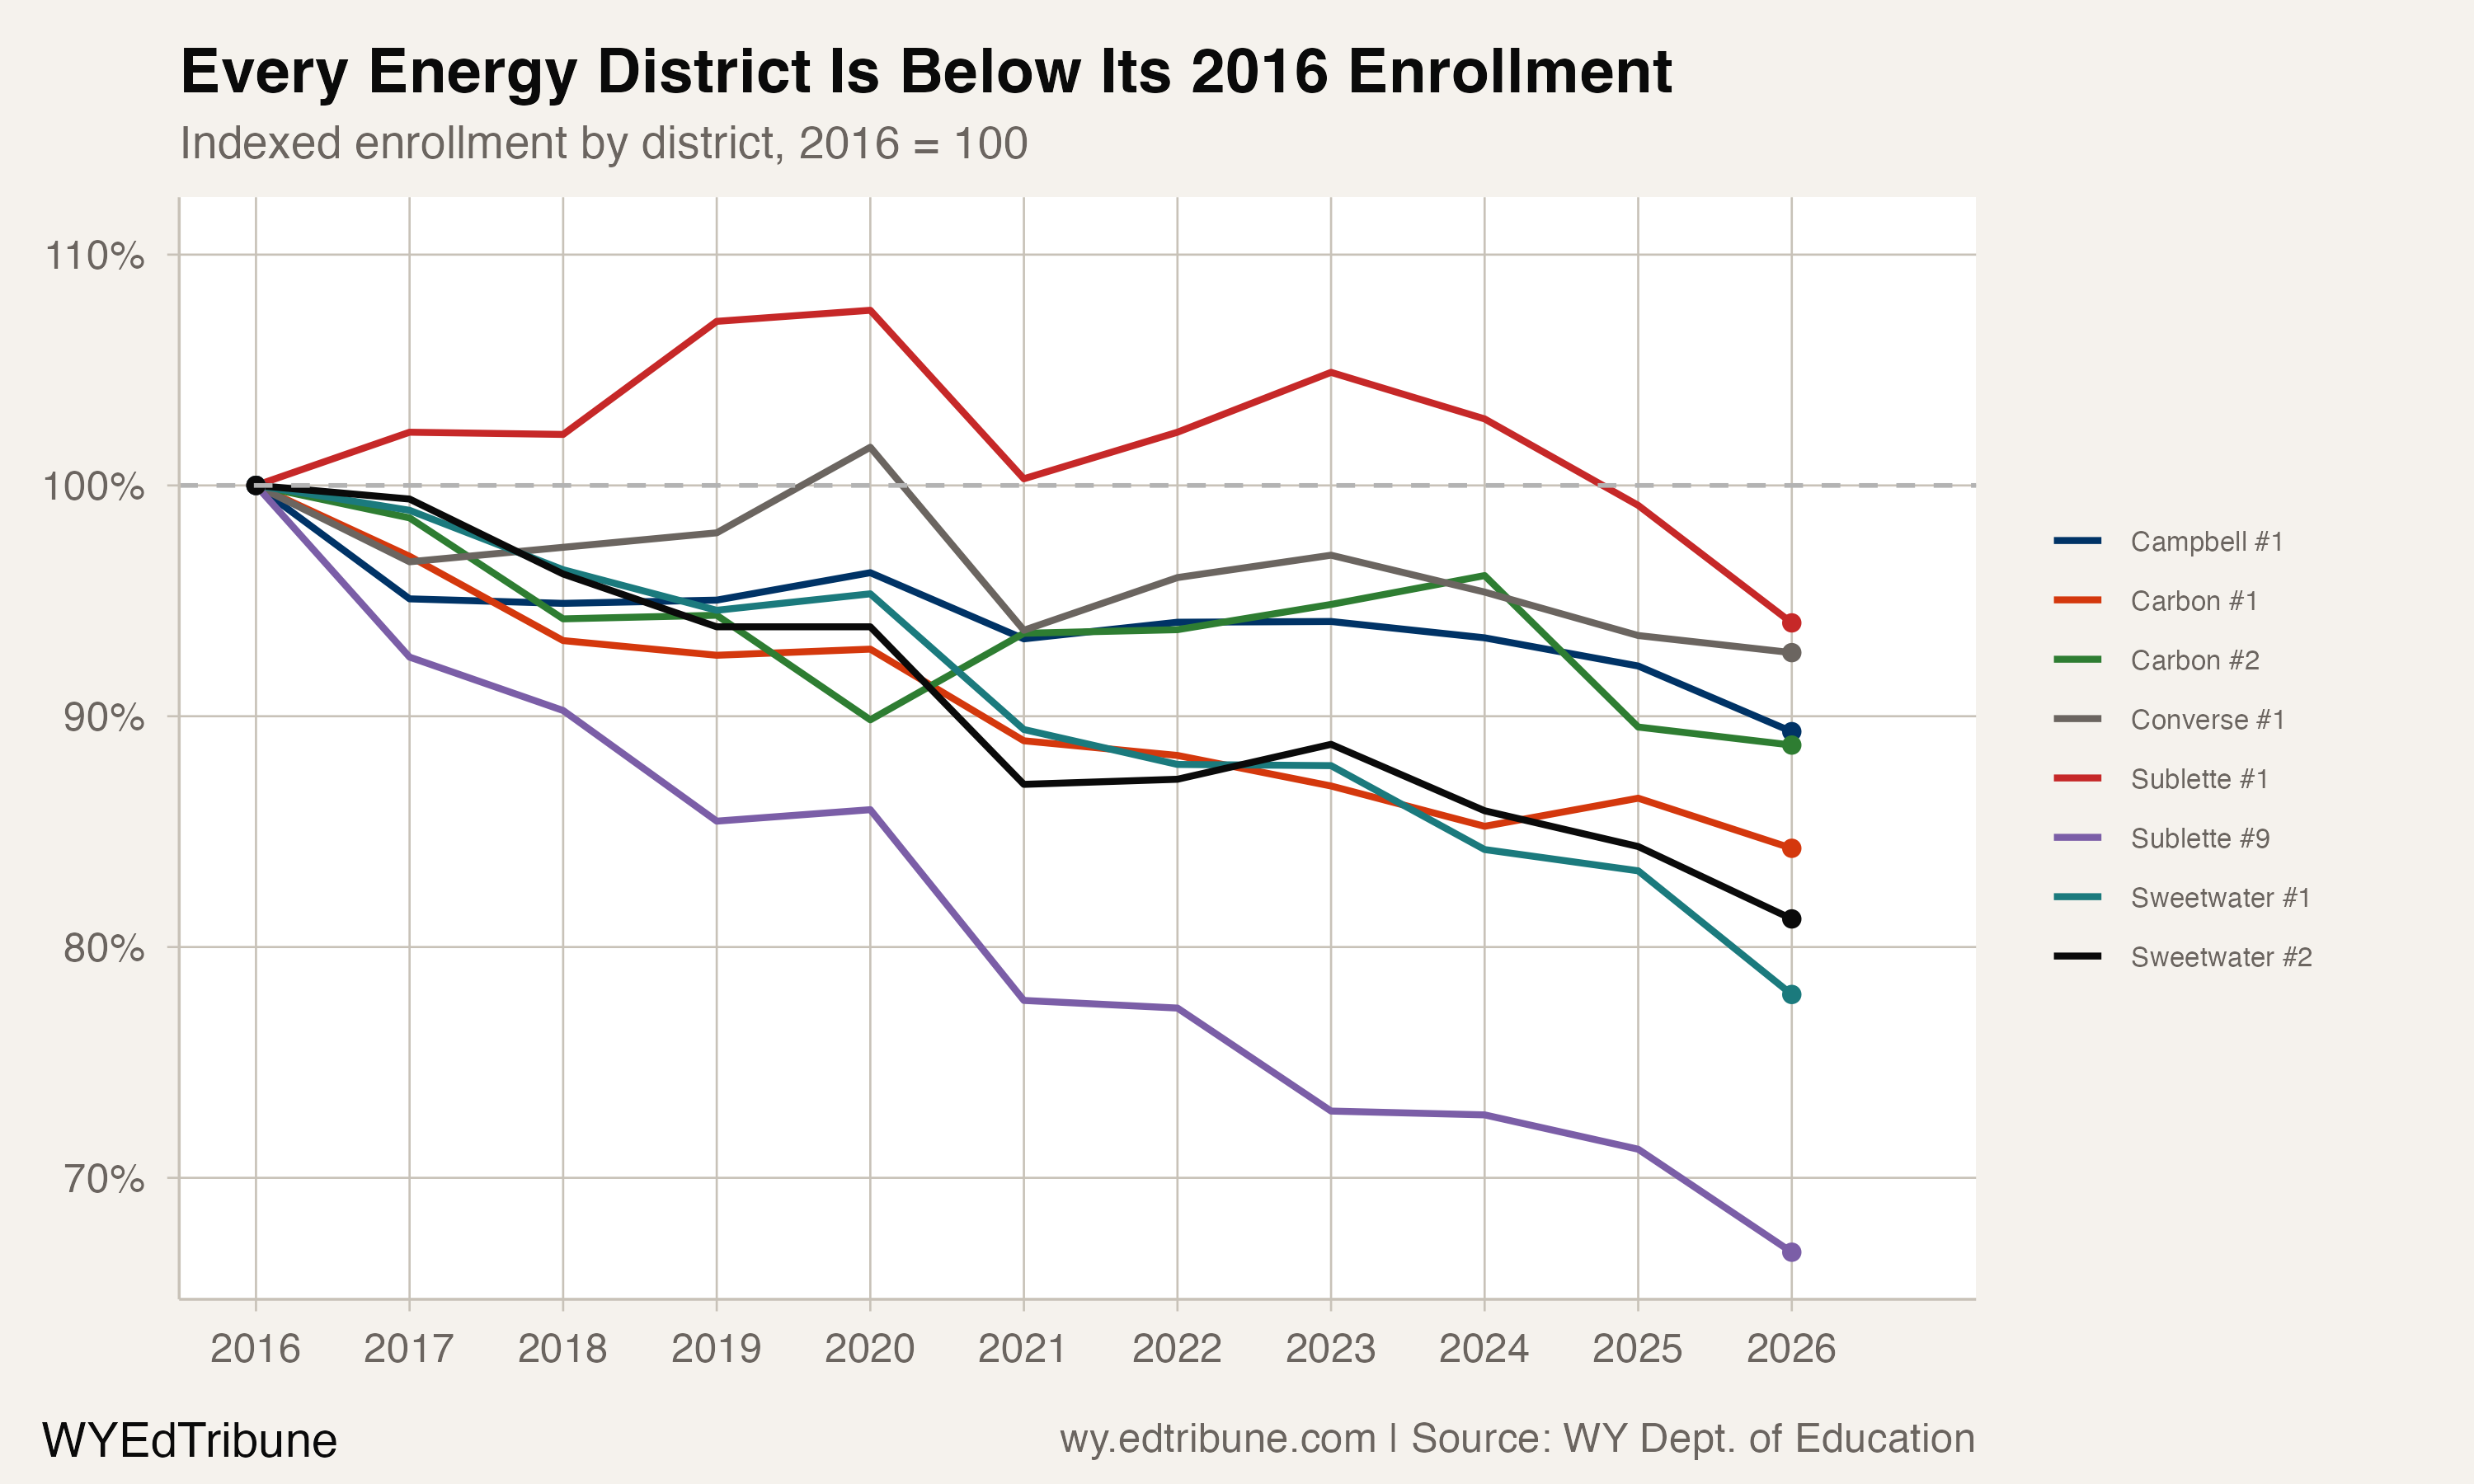
The combined loss across all eight energy districts since 2016 is 3,515 students. That accounts for 48 percent of the statewide decline of 7,257, despite these districts serving only about a quarter of the state's enrollment.
A structural, not cyclical, problem
Enrollment data alone cannot prove why families left. It can show the geography of the contraction: the energy-county districts fell faster than the rest of Wyoming, and every district in the group is below its 2016 level.
The non-energy districts are declining too, just more slowly. Their 5.3 percent loss since 2016 shows that this is not only an energy-county story. But the divide is stark: one set of districts lost 14.9 percent of enrollment, while the rest of the state lost 5.3 percent.
Detailed code that reproduces the analysis and figures in this article is available exclusively to EdTribune subscribers.
Discussion
Sign in to join the discussion.
Loading comments...